


Heads up: this model is deprecated
Pixtral 12B is no longer maintained and has been replaced by our latest, more powerful vision and multimodal models.
Pixtral 12B in short:
Natively multimodal, trained with interleaved image and text data
Strong performance on multimodal tasks, excels in instruction following
Maintains state-of-the-art performance on text-only benchmarks
Architecture:
New 400M parameter vision encoder trained from scratch
12B parameter multimodal decoder based on Mistral Nemo
Supports variable image sizes and aspect ratios
Supports multiple images in the long context window of 128k tokens
Use:
License: Apache 2.0
Try it on La Plateforme or on Le Chat
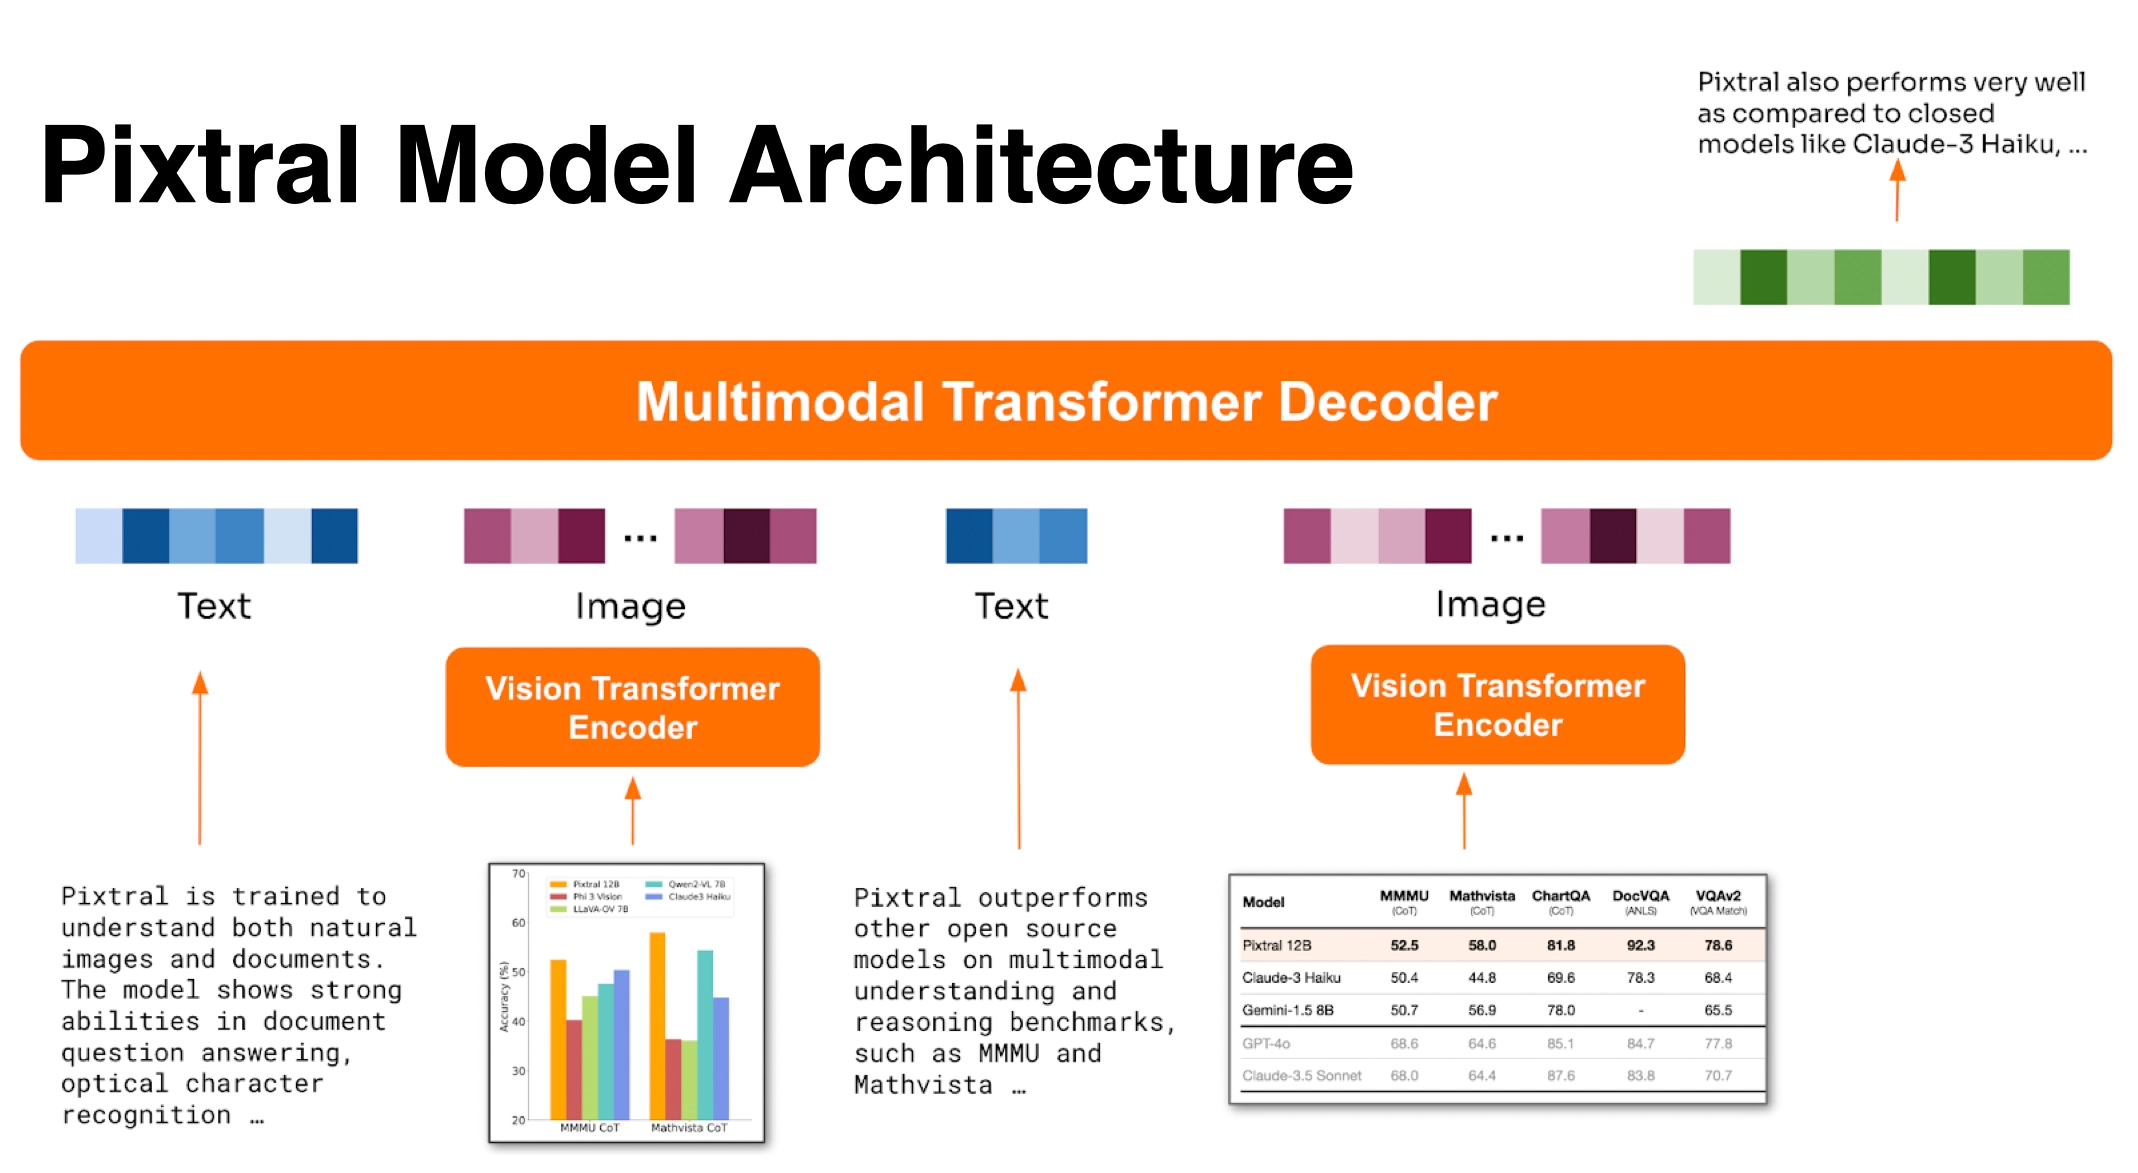
Pixtral is trained to understand both natural images and documents, achieving 52.5% on the MMMU reasoning benchmark, surpassing a number of larger models. The model shows strong abilities in tasks such as chart and figure understanding, document question answering, multimodal reasoning and instruction following. Pixtral is able to ingest images at their natural resolution and aspect ratio, giving the user flexibility on the number of tokens used to process an image. Pixtral is also able to process any number of images in its long context window of 128K tokens. Unlike previous open-source models, Pixtral does not compromise on text benchmark performance to excel in multimodal tasks.
Performance
Pixtral was trained to be a drop-in replacement for Mistral Nemo 12B. Its key distinguishing factor from existing open-source models is the delivery of best-in-class multimodal reasoning without compromising on key text capabilities such as instruction following, coding, and math.
Evaluation protocol
We re-evaluate a range of open and closed models through the same evaluation harness. For each dataset, the prompt was chosen such that we could reproduce the results of leading multimodal models (GPT-4o and Claude-3.5-Sonnet). All models were then evaluated with this same prompt. Overall, Pixtral substantially outperforms all open models around its scale and, in many cases, outperforms closed models such as Claude 3 Haiku. Pixtral even outperforms or matches the performance of much larger models like LLaVa OneVision 72B on multimodal benchmarks.All prompts will be open-sourced.
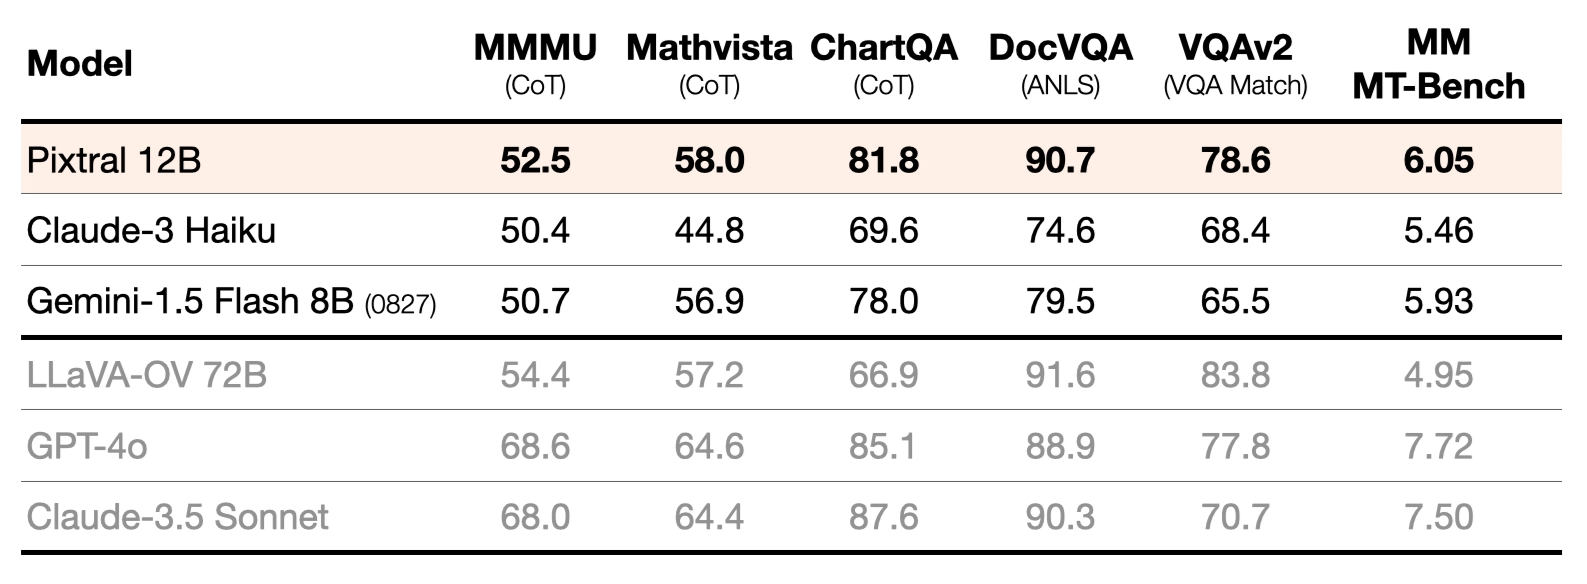
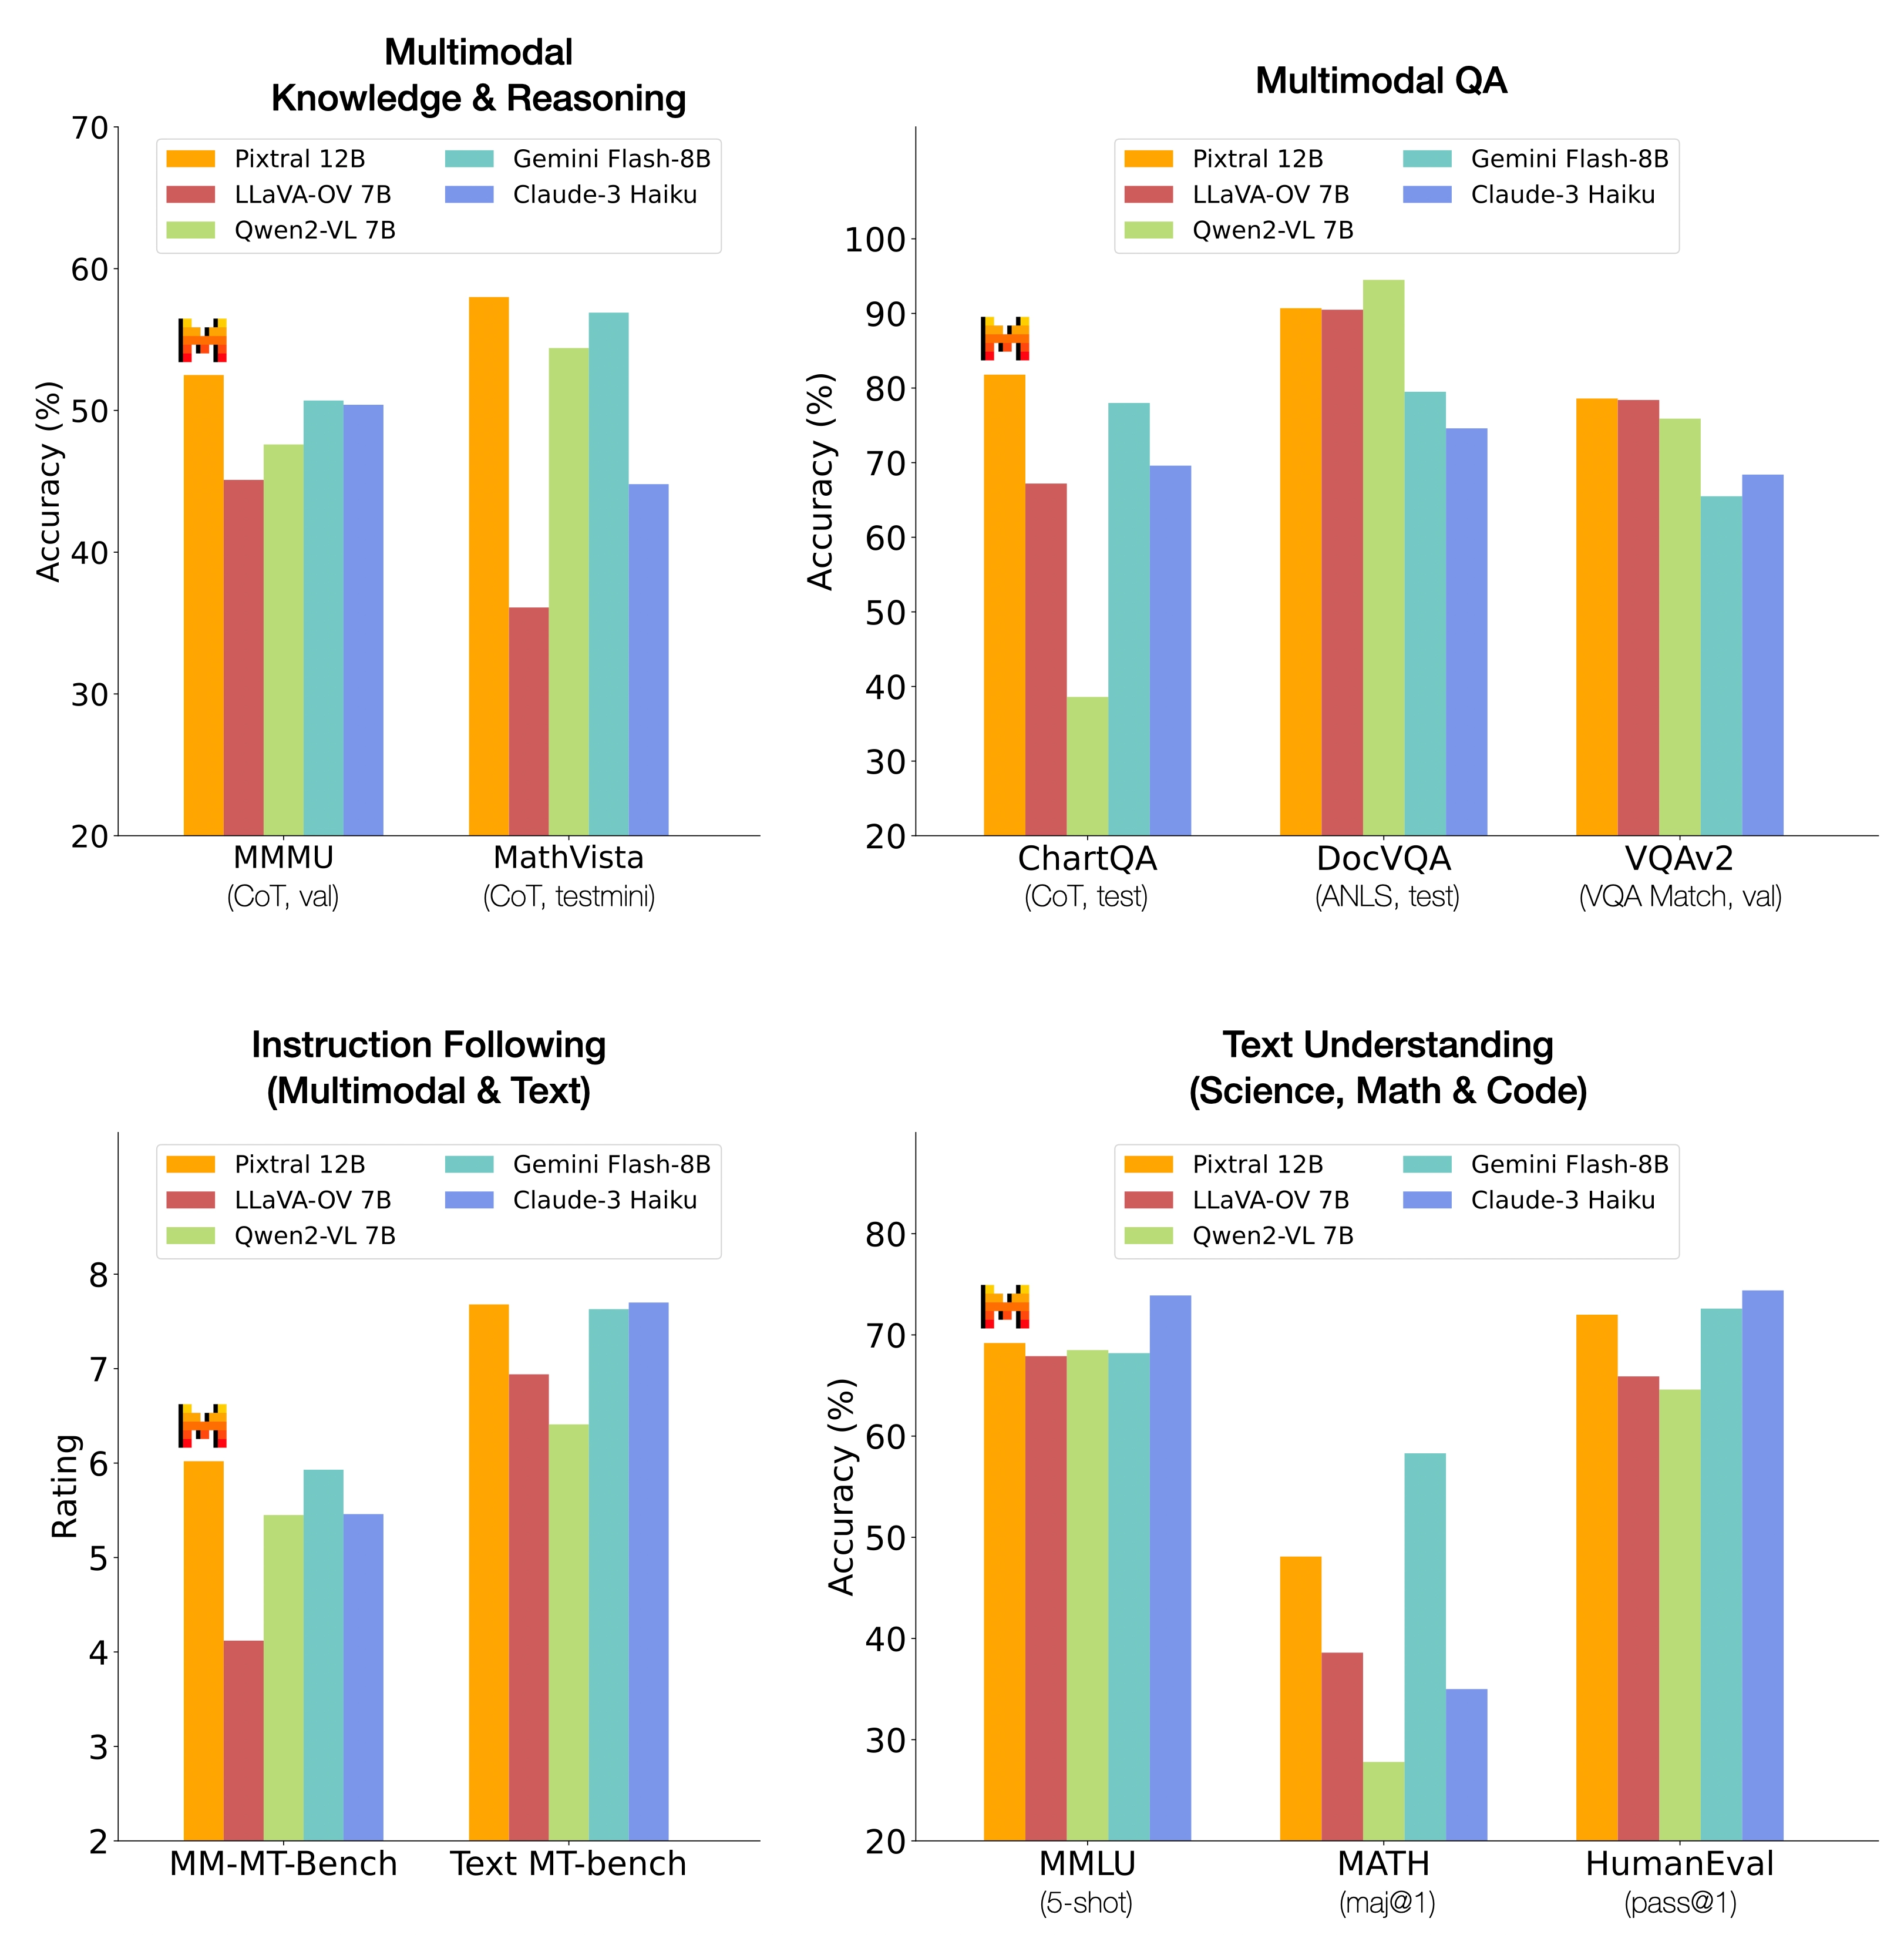
Performance of Pixtral compared to closed and larger multimodal models. [All models were benchmarked through the same evaluation harness and with the same prompt. We verify that prompts reproduce the performance reported for GPT-4o and Claude 3.5 Sonnet (prompts will be provided in technical report)].
Instruction following
Pixtral particularly excels at both multimodal and text-only instruction following as compared to other open multimodal models. It substantially outperforms Qwen2-VL 7B, LLaVa-OneVision 7B and Phi-3.5 Vision in instruction following, with a 20% relative improvement in text IF-Eval and MT-Bench over the nearest OSS model. To further evaluate this ability for multimodal use cases, we create multimodal versions of these benchmarks: MM-IF-Eval and MM-MT-Bench. Pixtral outperforms open-source alternatives on multimodal instruction following benchmarks as well. We will open-source MM-MT-Bench to the community.
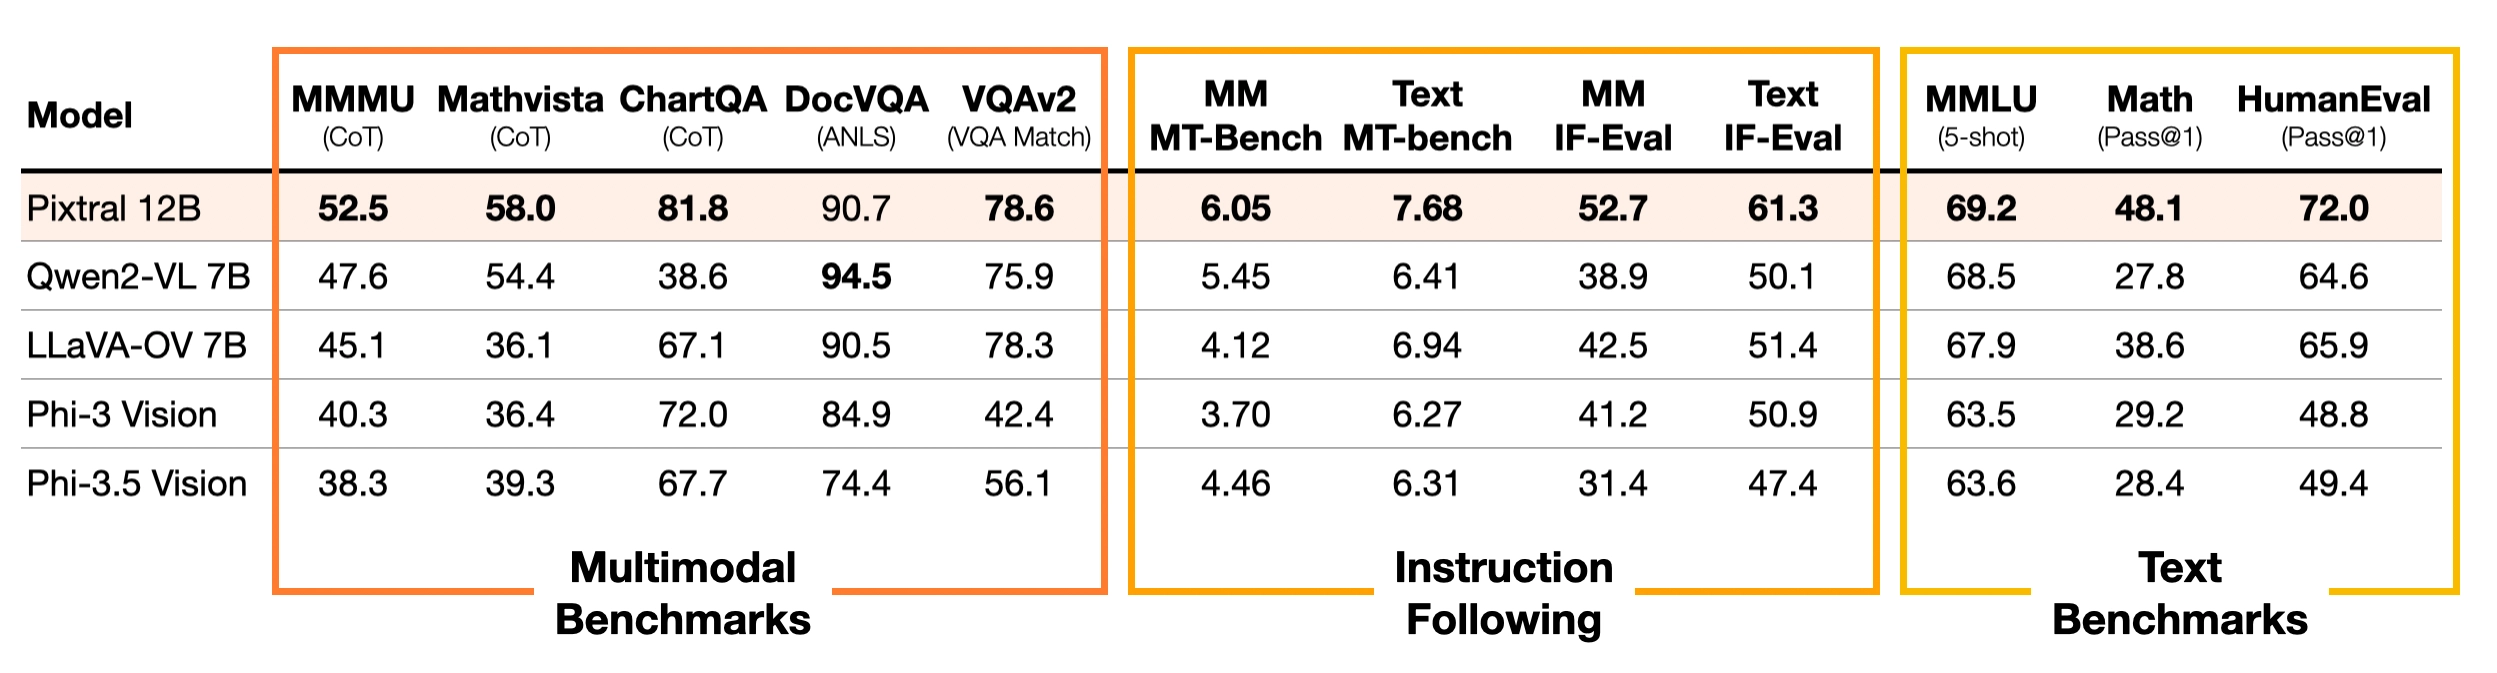
Performance of Pixtral compared to open multimodal models. All models were benchmarked through the same evaluation harness and with the same prompt.
Architecture
Variable image size: Pixtral is designed to optimize for both speed and performance. We trained a new vision encoder that natively supports variable image sizes:
We simply pass images through the vision encoder at their native resolution and aspect ratio, converting them into image tokens for each 16x16 patch in the image
These tokens are then flattened to create a sequence, with
[IMG BREAK]and[IMG END]tokens added between rows and at the end of the image.[IMG BREAK]tokens let the model distinguish between images of different aspect ratios with the same number of tokens.
In this way, Pixtral can be used to accurately understand complex diagrams, charts and documents in high resolution, while providing fast inference speeds on small images like icons, clipart, and equations.
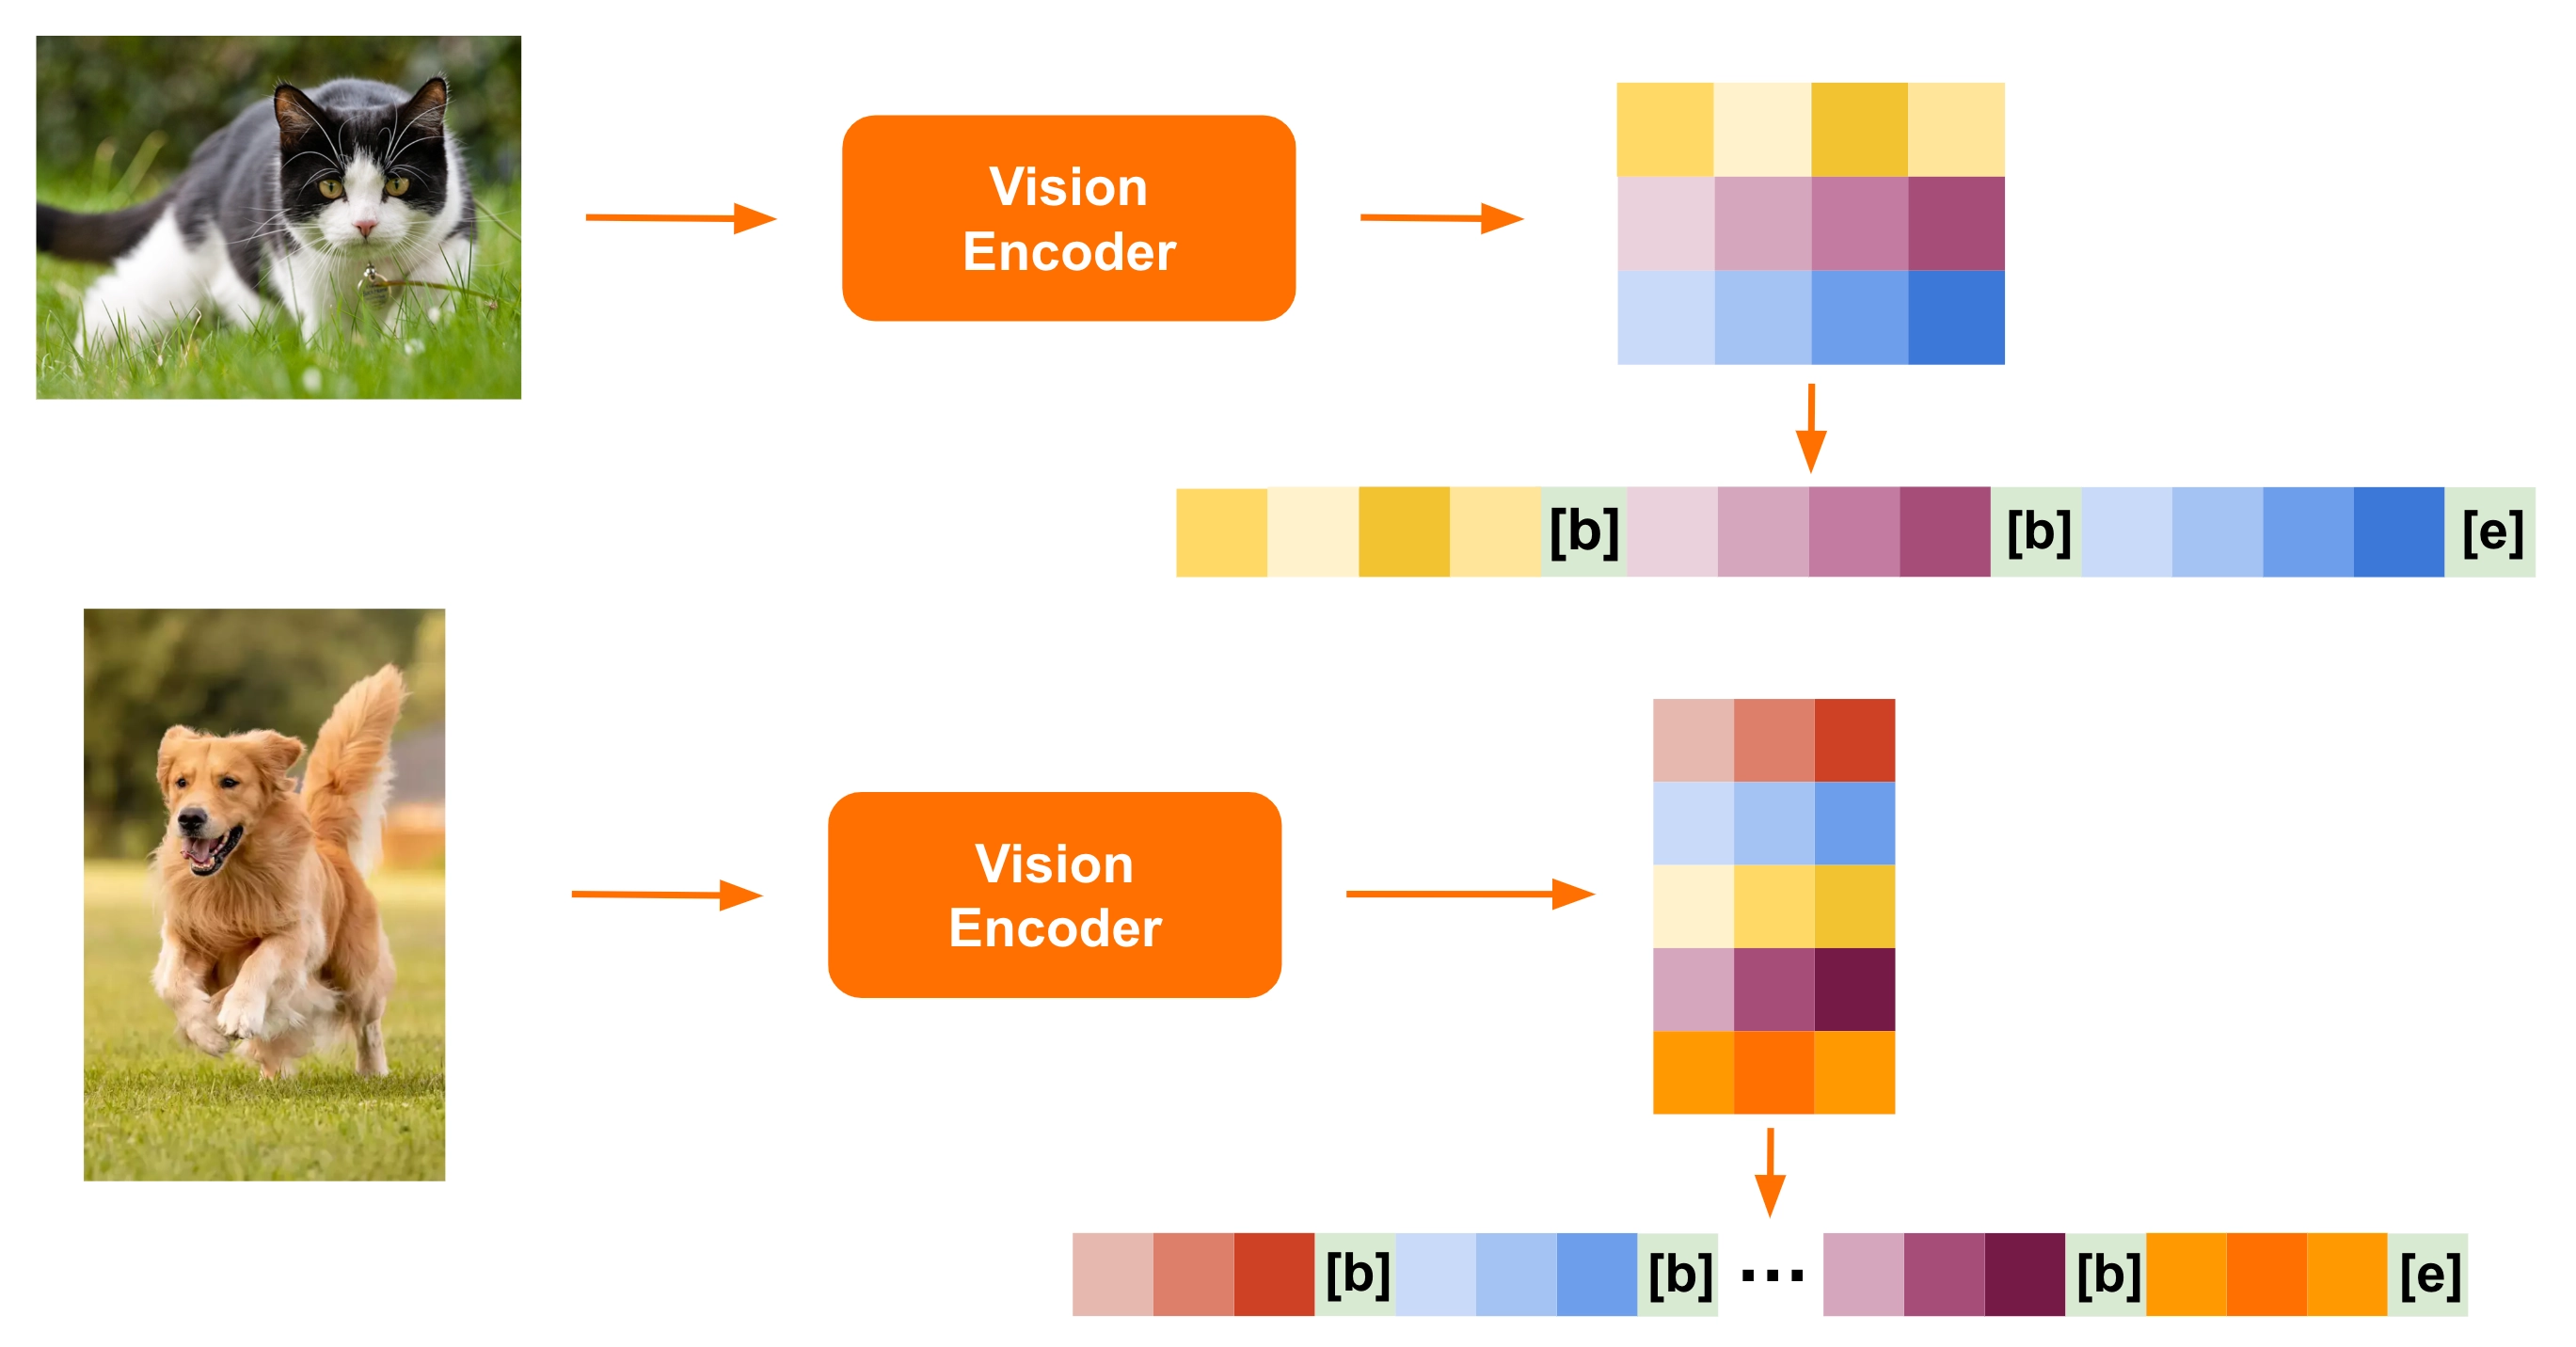
Pixtral uses a new vision encoder trained from scratch that natively supports variable image sizes.
Final architecture: Pixtral has two components: the Vision Encoder, which tokenizes images, and a Multimodal Transformer Decoder, which predicts the next text token given a sequence of text and images. The model is trained to predict the next text token on interleaved image and text data. This architecture allows Pixtral to process any number of images with arbitrary sizes in its large context window of 128K tokens.
Qualitative Examples
Reasoning over complex figures
This table combines the data from both tables, ensuring that all models and their respective scores from each benchmark are included in a single, cohesive format.
Prompt:
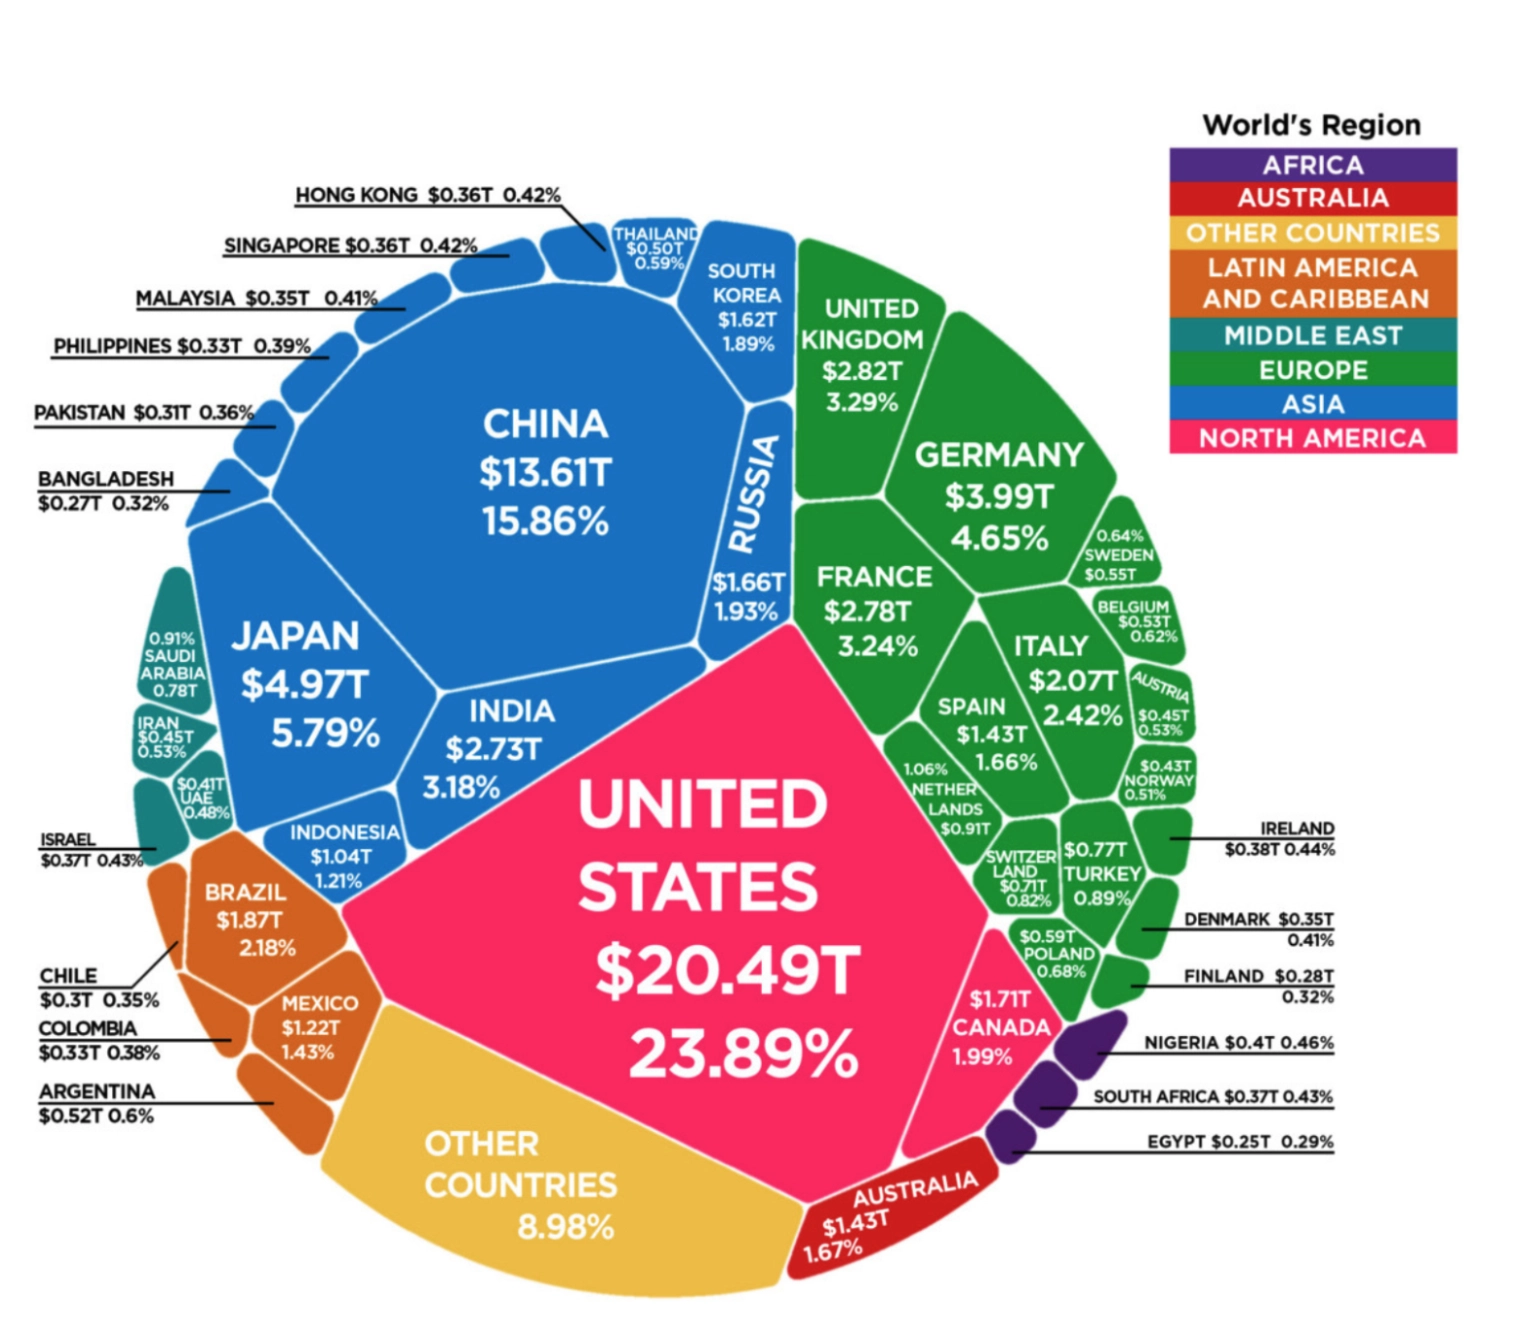
List the top 5 countries in Europe with the highest GDP
Response:
The top 5 countries in Europe with the highest GDP, based on the image, are:
Germany
GDP: $3.99 trillion
Percentage: 4.65%
United Kingdom
GDP: $2.82 trillion
Percentage: 3.29%
France
GDP: $2.78 trillion
Percentage: 3.24%
Italy
GDP: $2.07 trillion
Percentage: 2.42%
Spain
GDP: $1.43 trillion
Percentage: 1.66%
These countries are highlighted in green on the diagram.
Chart Understanding and Analysis
Image:
Prompt:
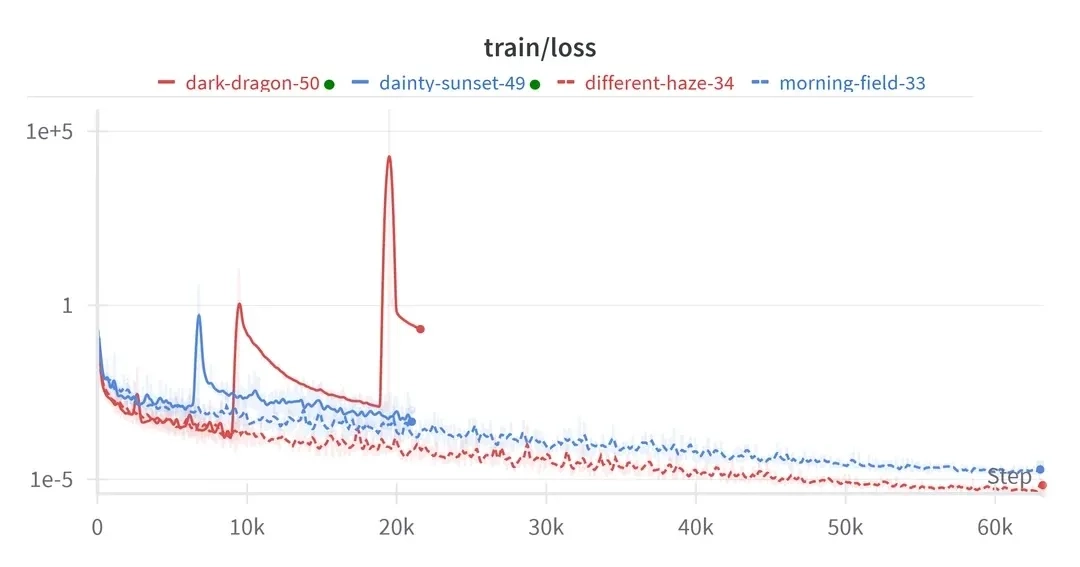
When did things start to go wrong for dark dragon?
Response:
The image is a line graph titled 'train/loss' that shows the training loss over steps for four different models: dark-dragon-50, dainty-sunset-49, different-haze-34, and morning-field-33. The x-axis represents the steps, ranging from 0 to 60k, and the y-axis represents the loss on a logarithmic scale from 1e-5 to 1e+5.
To determine when things started to go wrong for the dark-dragon-50 model, we need to look at the red line representing this model. Initially, the loss decreases, indicating that the model is learning effectively. However, around the 10k step mark, the loss starts to spike significantly. This spike indicates that the model's performance is deteriorating. The loss continues to spike and fluctuate, reaching very high values, which suggests that the model is not learning effectively and is likely overfitting or encountering other issues.
Therefore, the critical point where things started to go wrong for the dark-dragon-50 model is around the 10k step mark.
Multi-image instruction following
Images:
Prompt:
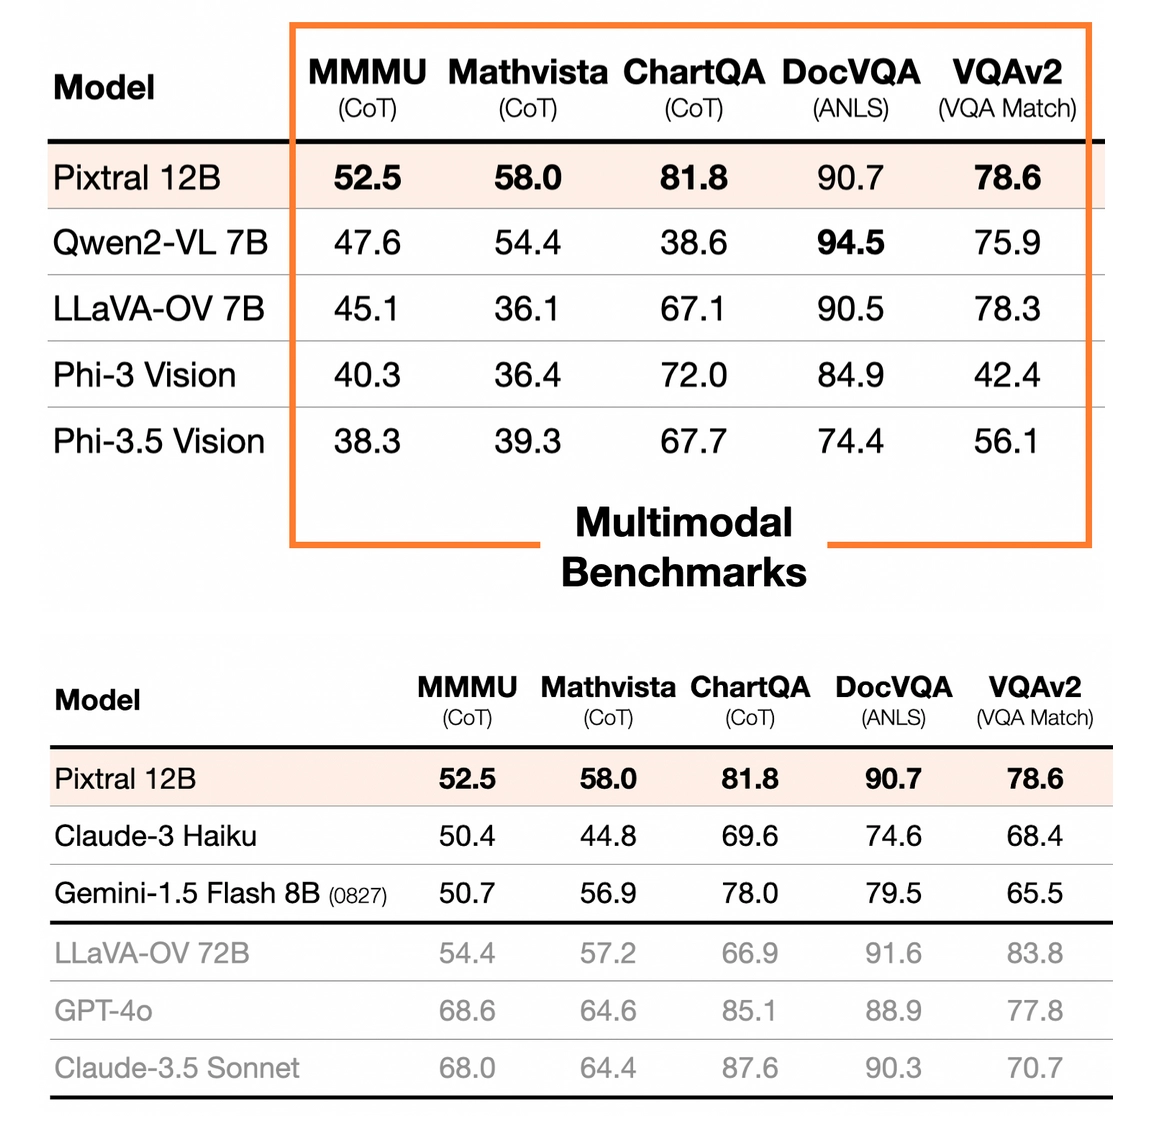
Combine information in both the tables into a single markdown table
Response:
To combine the information from both tables into a single table, we need to align the models and their corresponding scores from each benchmark. Here is the combined table:
| Model | MMMU (CoT) | Mathvista (CoT) | ChartQA (CoT) | DocVQA (ANLS) | VQAv2 (VQA Match) ||------------------------|------------|-----------------|---------------|---------------|-------------------|| Pixtral 12B | 52.5 | 58.0 | 81.8 | 90.7 | 78.6 || Claude-3 Haiku | 50.4 | 44.8 | 69.6 | 74.6 | 68.4 || Gemini-1.5 Flash 8B (0827) | 50.7 | 56.9 | 78.0 | 79.5 | 65.5 || LLaVA-OV 72B | 54.4 | 57.2 | 66.9 | 91.6 | 83.8 || GPT-4o | 68.6 | 64.6 | 85.1 | 88.9 | 77.8 || Claude-3.5 Sonnet | 68.0 | 64.4 | 87.6 | 90.3 | 70.7 || Qwen2-VL 7B | 47.6 | 54.4 | 38.6 | 94.5 | 75.9 || LLaVA-OV 7B | 45.1 | 36.1 | 67.1 | 90.5 | 78.3 || Phi-3 Vision | 40.3 | 36.4 | 72.0 | 84.9 | 42.4 || Phi-3.5 Vision | 38.3 | 39.3 | 67.7 | 74.4 | 56.1 |This table combines the data from both tables, ensuring that all models and their respective scores from each benchmark are included in a single, cohesive format.
Image to Code
Image:
Prompt:
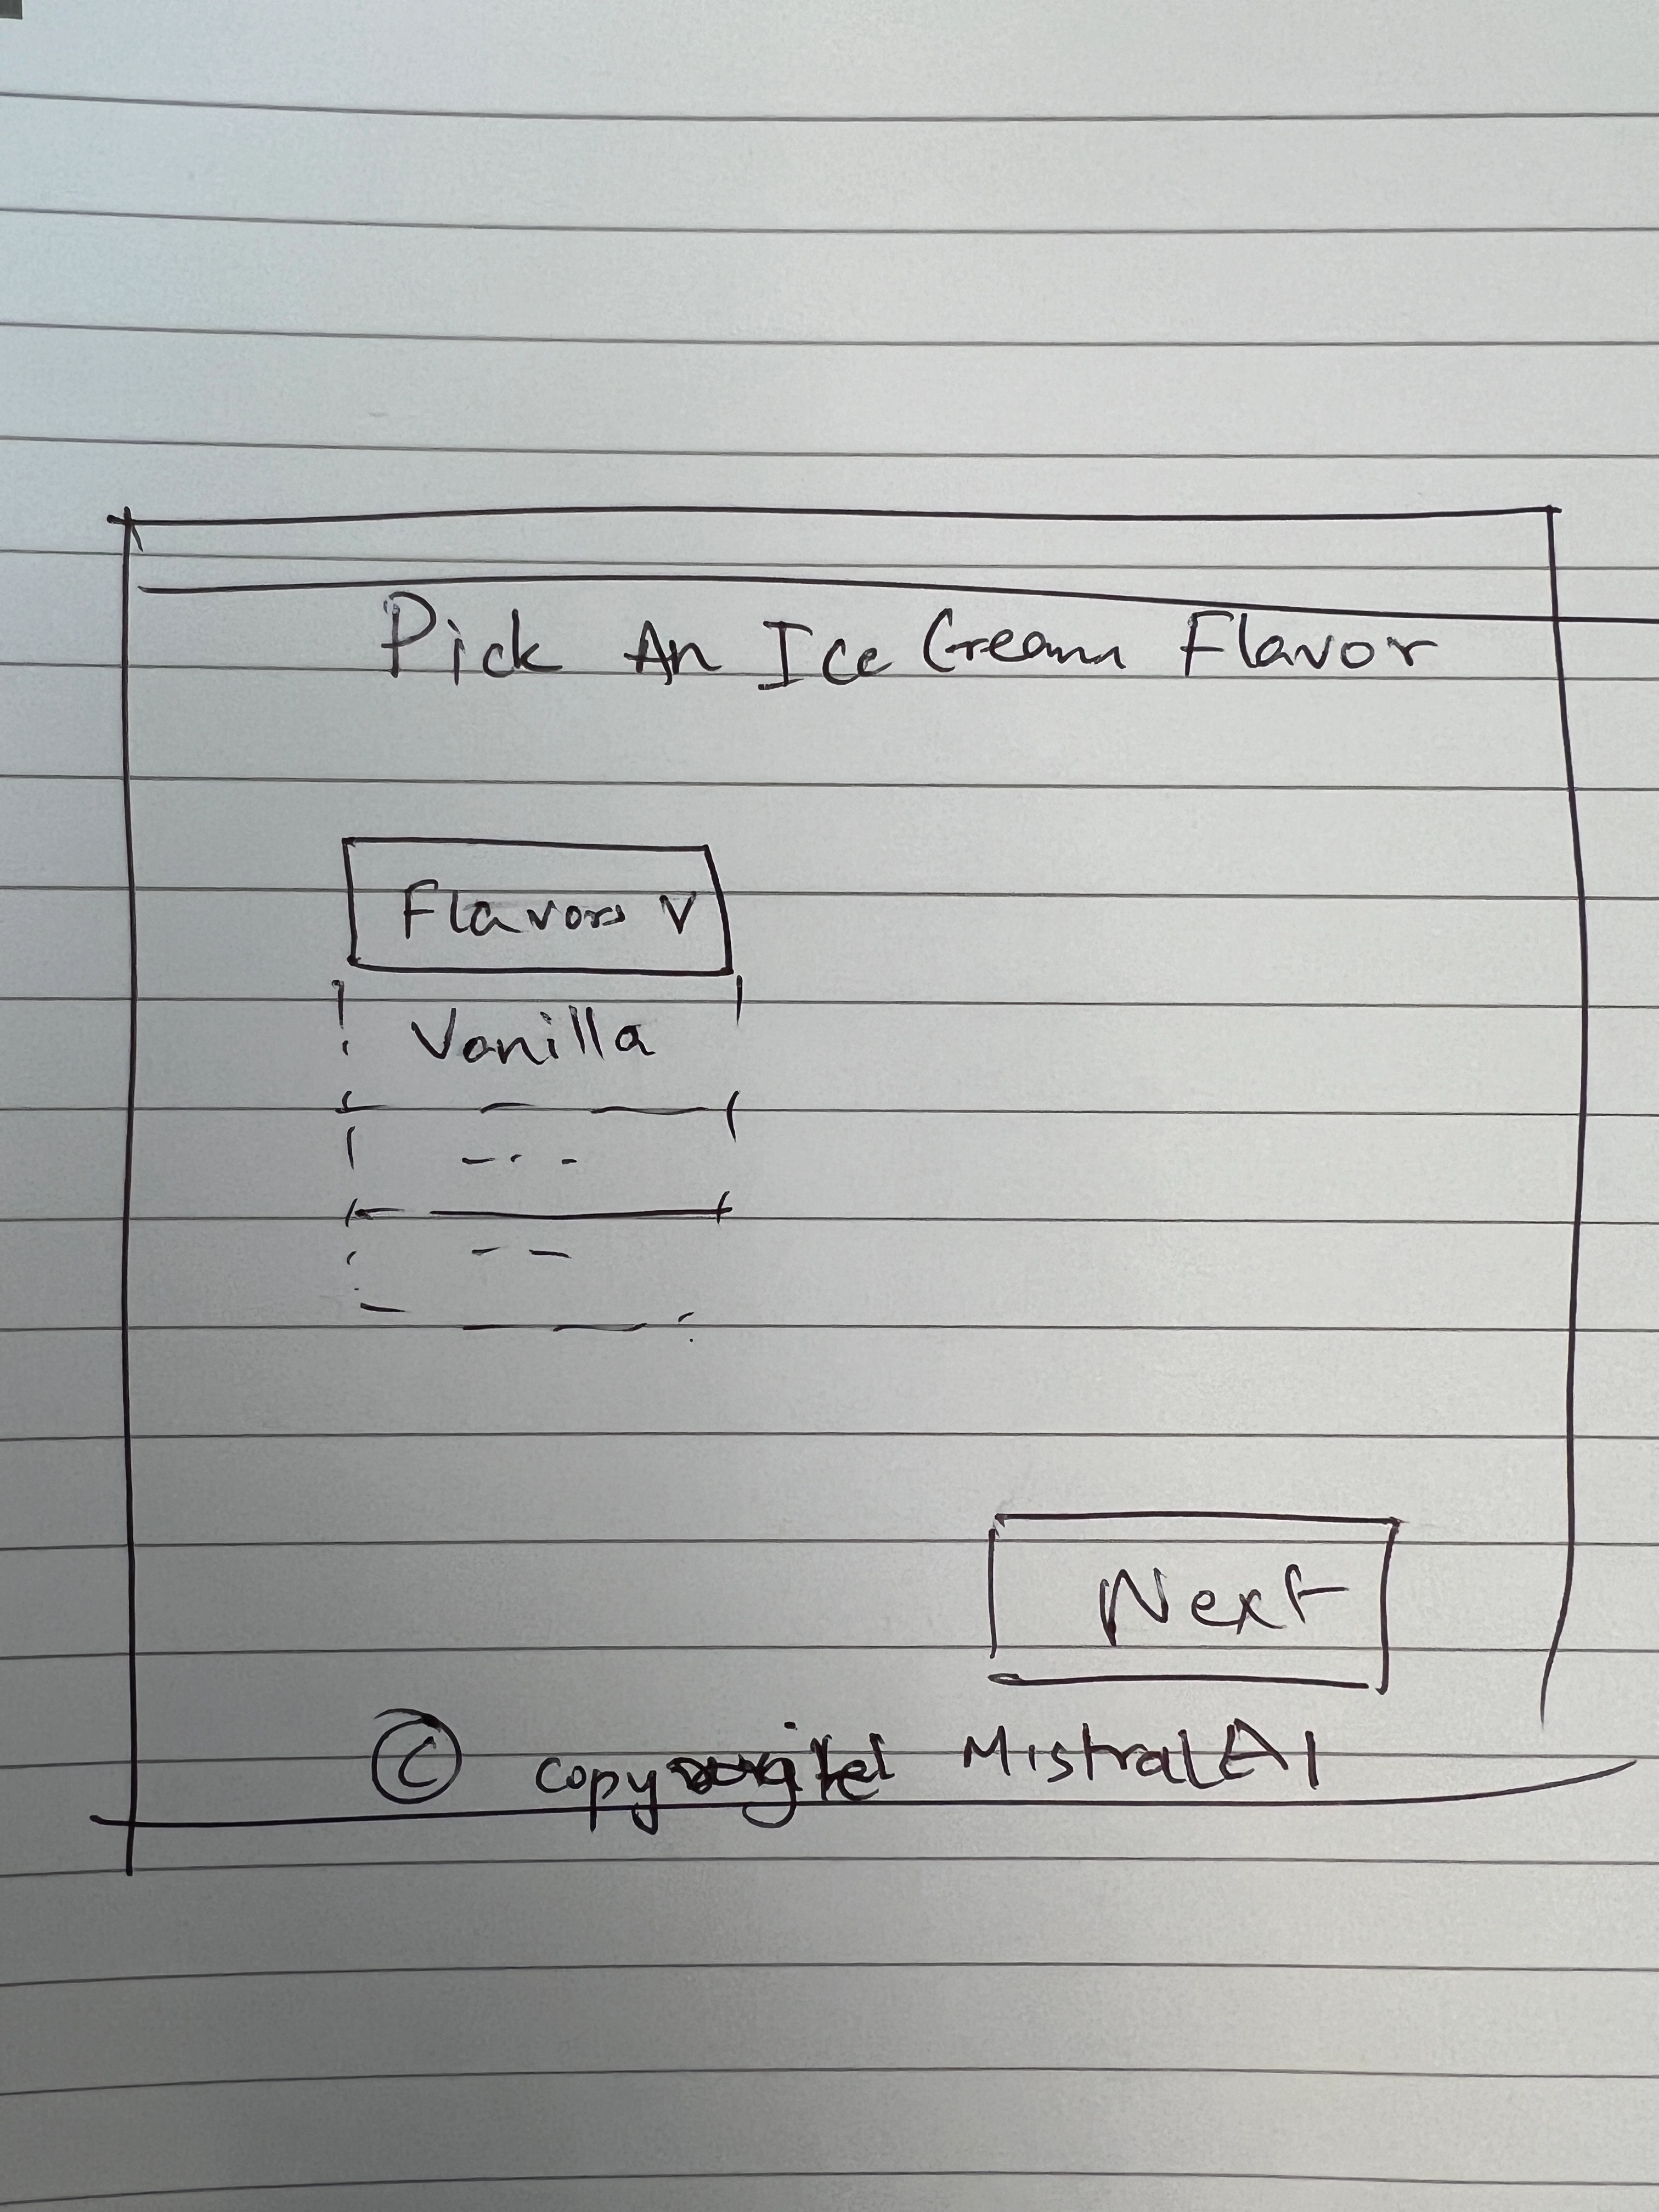
Write HTML code to create a website like this
Response:
Certainly! Below is an example of HTML code to create a simple webpage that allows users to pick an ice cream flavor. This example includes a dropdown menu for selecting the flavor and a "Next" button.
```html<!DOCTYPE html><html lang="en"><head> <meta charset="UTF-8"> <meta name="viewport" content="width=device-width, initial-scale=1.0"> <title>Pick an Ice Cream Flavor</title> <style> body { font-family: Arial, sans-serif; display: flex; justify-content: center; align-items: center; height: 100vh; background-color: #f0f0f0; } .container { background: white; padding: 20px; border-radius: 8px; box-shadow: 0 0 10px rgba(0, 0, 0, 0.1); } h1 { text-align: center; } select { width: 100%; padding: 10px; margin-top: 10px; margin-bottom: 20px; } button { width: 100%; padding: 10px; background-color: #4CAF50; color: white; border: none; border-radius: 4px; cursor: pointer; } button:hover { background-color: #45a049; } </style></head><body> <div class="container"> <h1>Pick An Ice Cream Flavor</h1> <select id="flavorSelect"> <option value="vanilla">Vanilla</option> <option value="chocolate">Chocolate</option> <option value="strawberry">Strawberry</option> <option value="cookie_dough">Cookie Dough</option> <option value="mint_chocolate">Mint Chocolate</option> </select> <button onclick="next()">Next</button> </div> <footer style="position: fixed; bottom: 0; width: 100%; text-align: center; font-size: 12px;"> © copyright MistralAI </footer> <script> function next() { const selectedFlavor = document.getElementById('flavorSelect').value; alert('You selected: ' + selectedFlavor); } </script></body></html>Explanation:
HTML Structure: The webpage consists of a container div that holds the heading, a dropdown menu, and a button.
CSS Styling: Basic styling is applied to center the content and style the elements.
JavaScript Function: The `next` function is called when the "Next" button is clicked. It retrieves the selected flavor from the dropdown menu and displays an alert with the chosen flavor.
You can copy and paste this code into an HTML file and open it in a web browser to see the result.
Website Generated:

Natural scene understanding
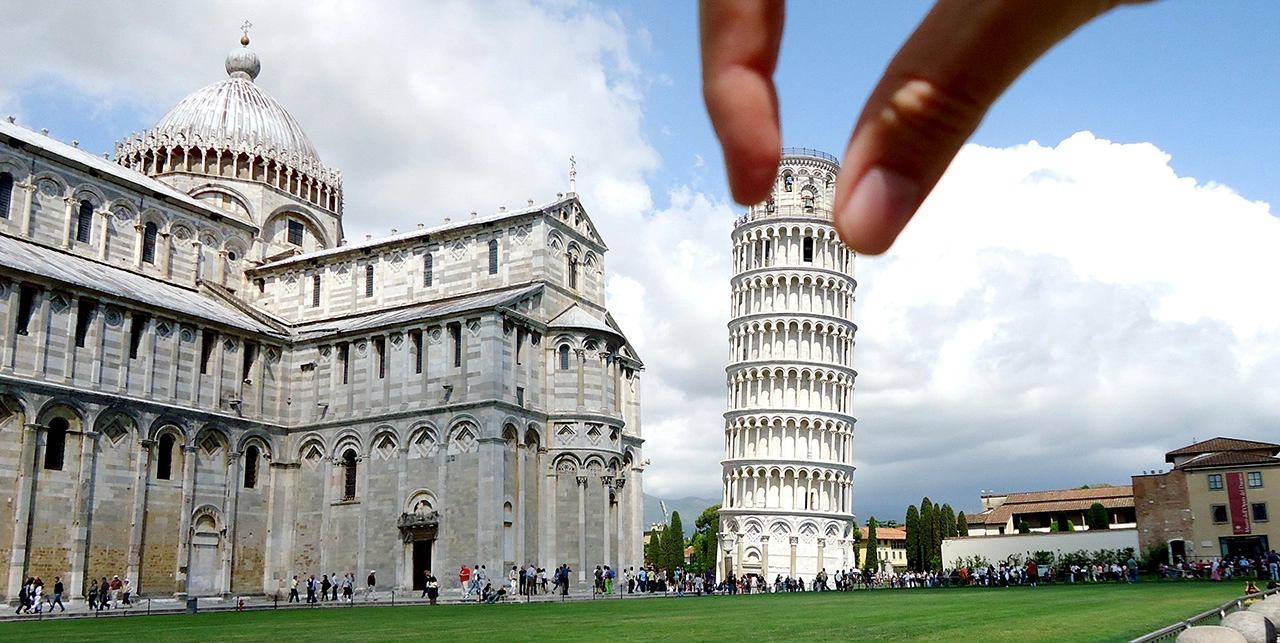
Prompt: Is this person really big, or is this building just super small?
Response:
The image shows a person holding their thumb in front of the Leaning Tower of Pisa, making it appear as if the thumb is much larger than the tower. This creates an optical illusion, making the tower seem smaller than it actually is. In reality, the Leaning Tower of Pisa is a large and iconic structure, and the person's thumb is not nearly as large as it appears in the image. The purpose of this photo is to demonstrate the impressive height and size of the tower by comparing it to a familiar object, such as a thumb.
How to run Pixtral?
Le Chat
You can try Pixtral easily and freely via Le Chat, our user-friendly conversational chat interface. You can choose Pixtral in the model list, upload an image, and start asking questions about the image.
La Plateforme
Pixtral is also available on La Plateforme. You can leverage Pixtral's capabilities through API calls, enabling seamless integration with various applications and workflows. Below is a simple example. Please find more details in our docs.
curl https://api.mistral.ai/v1/chat/completions \ -H "Content-Type: application/json" \ -H "Authorization: Bearer $MISTRAL_API_KEY" \ -d '{ "model": "pixtral-12b-2409", "messages": [ { "role": "user", "content": [ { "type": "text", "text": "What’s in this image?" }, { "type": "image_url", "image_url": "https://tripfixers.com/wp-content/uploads/2019/11/eiffel-tower-with-snow.jpeg" } ] } ], "max_tokens": 300 }'mistral-inference
The easiest way to run Pixtral locally is to use mistral-inference. After installing mistral_inference, you can download the model, load the model, and run the model using the code below. For detailed information, please see here.
# download the modelfrom huggingface_hub import snapshot_downloadfrom pathlib import Path
mistral_models_path = Path.home().joinpath('mistral_models', 'Pixtral')mistral_models_path.mkdir(parents=True, exist_ok=True)
snapshot_download(repo_id="mistralai/Pixtral-12B-2409", allow_patterns=["params.json", "consolidated.safetensors", "tekken.json"], local_dir=mistral_models_path)
# load the modelfrom mistral_inference.transformer import Transformerfrom mistral_inference.generate import generate
from mistral_common.tokens.tokenizers.mistral import MistralTokenizerfrom mistral_common.protocol.instruct.messages import UserMessage, TextChunk, ImageURLChunkfrom mistral_common.protocol.instruct.request import ChatCompletionRequest
tokenizer = MistralTokenizer.from_file(f"{mistral_models_path}/tekken.json")model = Transformer.from_folder(mistral_models_path)
# Run the modelurl = "https://huggingface.co/datasets/patrickvonplaten/random_img/resolve/main/yosemite.png"prompt = "Describe the image."
completion_request = ChatCompletionRequest(messages=[UserMessage(content=[ImageURLChunk(image_url=url), TextChunk(text=prompt)])])
encoded = tokenizer.encode_chat_completion(completion_request)
images = encoded.imagestokens = encoded.tokens
out_tokens, _ = generate([tokens], model, images=[images], max_tokens=256, temperature=0.35, eos_id=tokenizer.instruct_tokenizer.tokenizer.eos_id)result = tokenizer.decode(out_tokens[0])
print(result)
vLLM
If you choose to serve Pixtral locally, we also recommend using Pixtral with the vLLM library as a fantastic option to reach higher serving throughput. We thank the vLLM team for their support to integrate Pixtral quickly. Below is a simple usage example. Please find more information here.
from vllm import LLMfrom vllm.sampling_params import SamplingParams
model_name = "mistralai/Pixtral-12B-2409"
sampling_params = SamplingParams(max_tokens=8192)
llm = LLM(model=model_name, tokenizer_mode="mistral")
prompt = "Describe this image in one sentence."image_url = "https://picsum.photos/id/237/200/300"
messages = [    {        "role": "user",        "content": [{"type": "text", "text": prompt}, {"type": "image_url", "image_url": {"url": image_url}}]    },]
outputs = vllm_model.model.chat(messages, sampling_params=sampling_params)
print(outputs[0].outputs[0].text)